When the Market Goes to Therapy
A behavioral diagnosis of investor sentiment and market dynamics
Session 1: The Intake
Meet the Patient
Date: March 2020. Presenting symptoms: Severe mood swings. Patient experienced a 34% decline in just 23 trading days. Investors reported extreme bearish sentiment. Google searches for "market crash" and "recession" spiked to unprecedented levels.
Clinical question: Did the collective anxiety cause the crash, predict it, or simply react to it?
They call us when nobody else can figure it out. We're empanADA: leading experts in behavioral psychology. But nothing prepared us for this patient. The Market doesn't talk. It doesn't sit on our couch and tell us about its childhood. Instead, it communicates through price movements, volatility spikes, and regime shifts. To understand it, we must observe the people in its life: the ones who interact with it daily and claim to know what it's thinking.
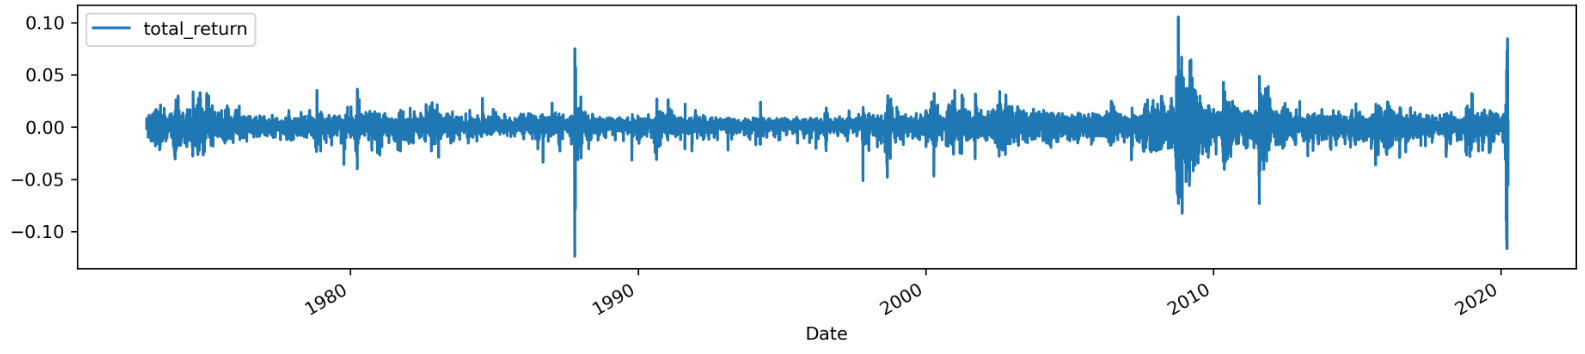
First of all, let's check the pulse! For the market, that pulse is its daily returns — a continuous signal that reflects stress, calm, and sudden shocks. Before interpreting sentiment or regimes, we listen to this heartbeat.
↺ Click to view calculation details
Methodology: Equally Weighted Returns
We compute the market-level return at time t as an equal-weighted average of individual stock returns:
Where Nt is the number of stocks with valid returns on date t, and Pi,t is the adjusted closing price of stock i.
Next: The Patient's Support Network
We can't interview The Market directly. But we can study the two groups who spend the most time with it:
The Inner Circle
AAII (a.k.a. American Association of Individual Investors) Weekly Sentiment Survey
Active investors who interact with the patient every week. They report their expectations directly: "Where do you think the market will be in 6 months?"
- Informed
- Explicit predictions
- Weekly frequency
- Since 1987
The General Public
Google Trends Search Behavior
Society at large: their collective search behavior reveals unconscious fears and hopes about the economy. They don't know they're being observed.
- Spontaneous
- Implicit sentiment
- Real-time signals
- Massive scale
Do investors’ predictions pull the market in a certain direction, or are they largely reactions to market movements that have already begun?
Are the millions of people trying to read the market actually destabilizing it? Is the patient's support system… toxic?
Two Competing Hypotheses
Before we begin our analysis, we must acknowledge two fundamentally different ways this relationship could work:
Sentiment Has Power
Hypothesis AInvestors look ahead. Their collective expectations shape capital flows, which move prices. Beliefs become self-fulfilling prophecies.
Sentiment Is Just a Mirror
Hypothesis BMarkets move because of fundamentals, shocks, and institutional flows. Retail investors simply update their views afterward, explaining what already happened.
Session Notes
Only one of these hypotheses can dominate in the data. Armed with decades of price history, sentiment surveys, and search data (plus statistical tools sharper than any scalpel) we're going in.
Let's meet the witnesses.
Session 2: The Witness Profiles
Two Perspectives on the Patient
To understand our patient, we interview two key witness groups separately. First, the Inner Circle (AAII survey respondents): investors who explicitly report their expectations. Then, the General Public, whose unconscious fears and hopes are revealed through Google search behavior.
Part A: The Inner Circle Speaks
Every week since 1987, members of the American Association of Individual Investors have answered one simple question:
AAII Weekly Sentiment Survey
"Where do you think the market will be in the next 6 months?"
Whatever your choice, you've just joined millions of investors who make this call regularly. Now let's see what the data reveals about their collective psychology.
Finding 1: A Baseline of Optimism
Clinical Observation
Across 33 years of data, bullish sentiment is the baseline state, accounting for 37.6% of all observations. Neutral and bearish views each represent about 31%.
This asymmetry reveals something fundamental about investor psychology: optimism is the default. Even accounting for recessions, crashes, and bear markets, investors expect growth more often than decline.
This isn't irrational: markets have historically trended upward. But it raises a question: when investors turn bearish, is it because they're seeing something, or because they just saw something?
The violin plots tell us more. Bullish sentiment centers around 35-40% with occasional surges above 60%. It's symmetric: optimism can be extreme in either direction.Bearish sentiment is different. It clusters around 25-30% but shows a right skew. This indicates that deep pessimism is rare, appearing only in acute stress episodes.Neutral sentiment is the most stable, consistently hovering near 30%.
Finding 2: Beliefs Are Sticky
Levels tell us what investors believe. But to understand behavior, we need to study transitions, how sentiment changes from week to week.
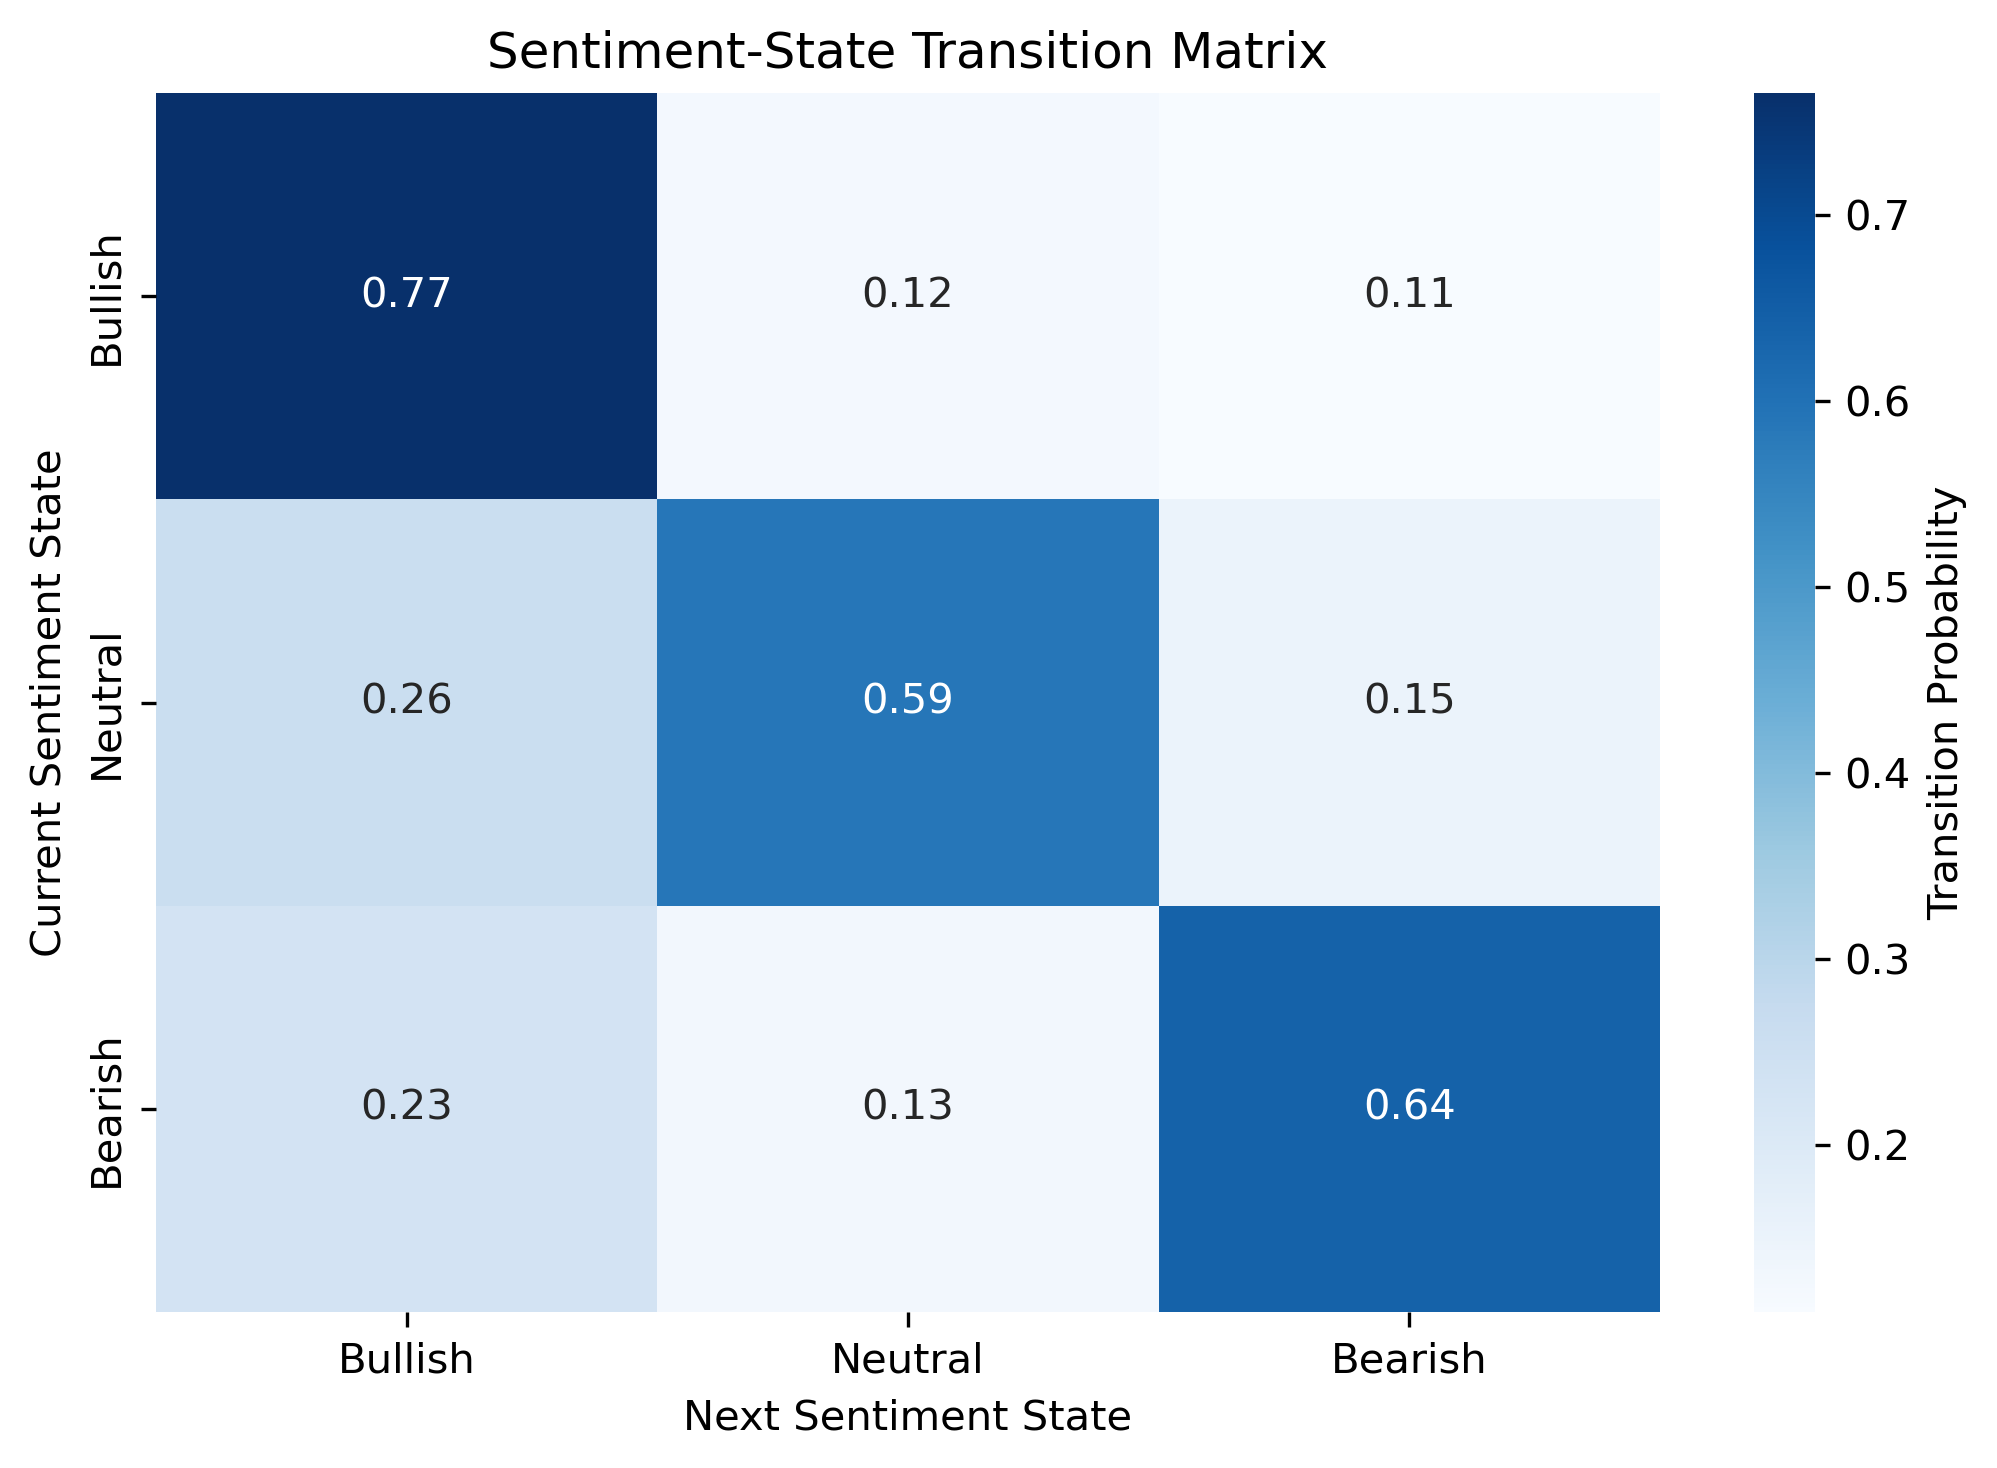
Reading the Transition Matrix
Each cell shows the probability of moving from one sentiment state (row) to another (column) in a single week:
Key Insight: Sentiment states are highly persistent. When investors are optimistic, they tend to stay optimistic. But crucially, pessimism is less sticky than optimism: bad moods pass faster than good ones. This asymmetry will matter when we study market regimes.
Finding 3: Critical Moments: When Beliefs Shift Suddenly
To better understand how investor expectations evolve over time, we analyze the sudden week-to-week changes in Bullish, Neutral, and Bearish sentiment. Examining sudden shifts allows us to identify moments when investors rapidly changed their outlook. This helps us assess whether shifts in sentiment tend to anticipate market developments or react to them.
The interactive time-series plots reveal that sentiment typically evolves smoothly from week to week, but sharp discontinuities do occur. These sudden increases correspond to moments when investors rapidly changed their expectations, likely due to major market events or shifts in uncertainty. The difference in the density and magnitude of spikes across the three sentiment states suggests that Bearish sentiment is the most sensitive to shocks.
Part B: The General Public Under the Microscope
Survey data tells us what investors say they believe. But beliefs aren't always articulated. Sometimes they show up through what people search when worried, curious, or excited. Google Trends provides this unconscious pulse.
Search Query Classification
Every week, millions of searches reveal what market participants are paying attention to. Unlike surveys, these searches are spontaneous, unfiltered, and often emotional. We classified Google search queries into three sentiment categories based on their economic meaning:
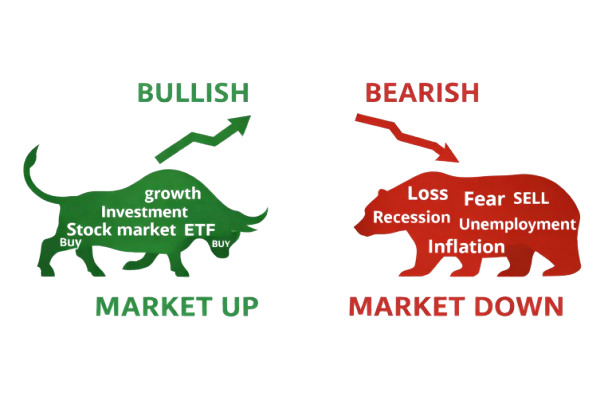
Bullish Indicators
- "Investment"
- "Stock market"
- "Exchange-traded fund"
Growth-oriented, opportunity-seeking
Neutral Indicators
- "Dow Jones"
- "Nasdaq"
- "S&P 500"
Information-seeking, monitoring
Bearish Indicators
- "Recession"
- "Unemployment"
- "Inflation"
Fear-driven, risk-focused
Search Patterns Across Market Cycles
Pattern Observed
Bullish searches build gradually during expansions; people slowly become more interested in investing as confidence grows.
Bearish searches spike sharply during stress; fear triggers immediate information-seeking. The asymmetry mirrors what we saw in AAII sentiment.
Correlation: Do Search Behaviors Move Together?
Understanding the Correlations
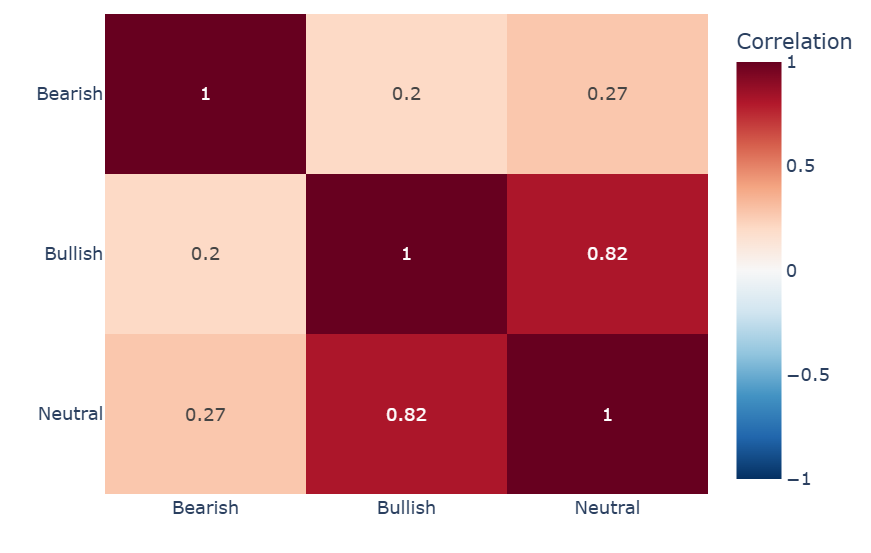
These correlation matrices reveal how Google search terms cluster together within and across sentiment categories. Red cells indicate strong positive correlations, while blue cells show weak or negative correlations. Click on a category above to explore specific search behavior patterns.
Key Findings
Neutral (0.71–0.97): Index searches are highly unified—users checking one index check them all.
Bearish (0.01): Inflation and Unemployment searches are uncorrelated—anxiety is issue-specific, not generalized.
Bullish (0.65): "Stock Market" and "ETF" are linked, but "Investment" remains broader.
Cross-category (0.82): Neutral and Bullish overlap strongly; Bearish stands apart.
Market optimism is broad and interconnected; market anxiety is isolated and threat-specific. When people feel bullish, their searches span indices, ETFs, and investments in unison. When fear strikes, attention fragments—users fixate on either inflation or unemployment, rarely both. This asymmetry suggests that confidence is a rising tide, while panic is a series of isolated waves.
Session 2 Summary: What the Witnesses Told Us
Optimism is the baseline. Investors are bullish more often than bearish.
Beliefs are sticky. Once in a sentiment state, investors tend to stay there, but pessimism fades faster than optimism.
Fear arrives suddenly. Bearish sentiment shows the largest and fastest changes during market stress.
Two signals, same psychology. AAII surveys and Google searches capture different but related aspects of investor sentiment.
Next Session Preview
We've profiled the witnesses. Now comes the critical question: Who moves first? Does sentiment lead market movements, or does it simply follow them?
Time for the timeline analysis.
Session 3: The Timeline
Who Moves First?
Everything we've learned leads here. We have two witnesses (AAII and Google) and one patient (The Market). Now we determine the direction of causality: Does sentiment lead, follow, or move with the market?
The Initial Evidence: Correlation
We begin with a simple but essential question: is investor sentiment related to returns at all?
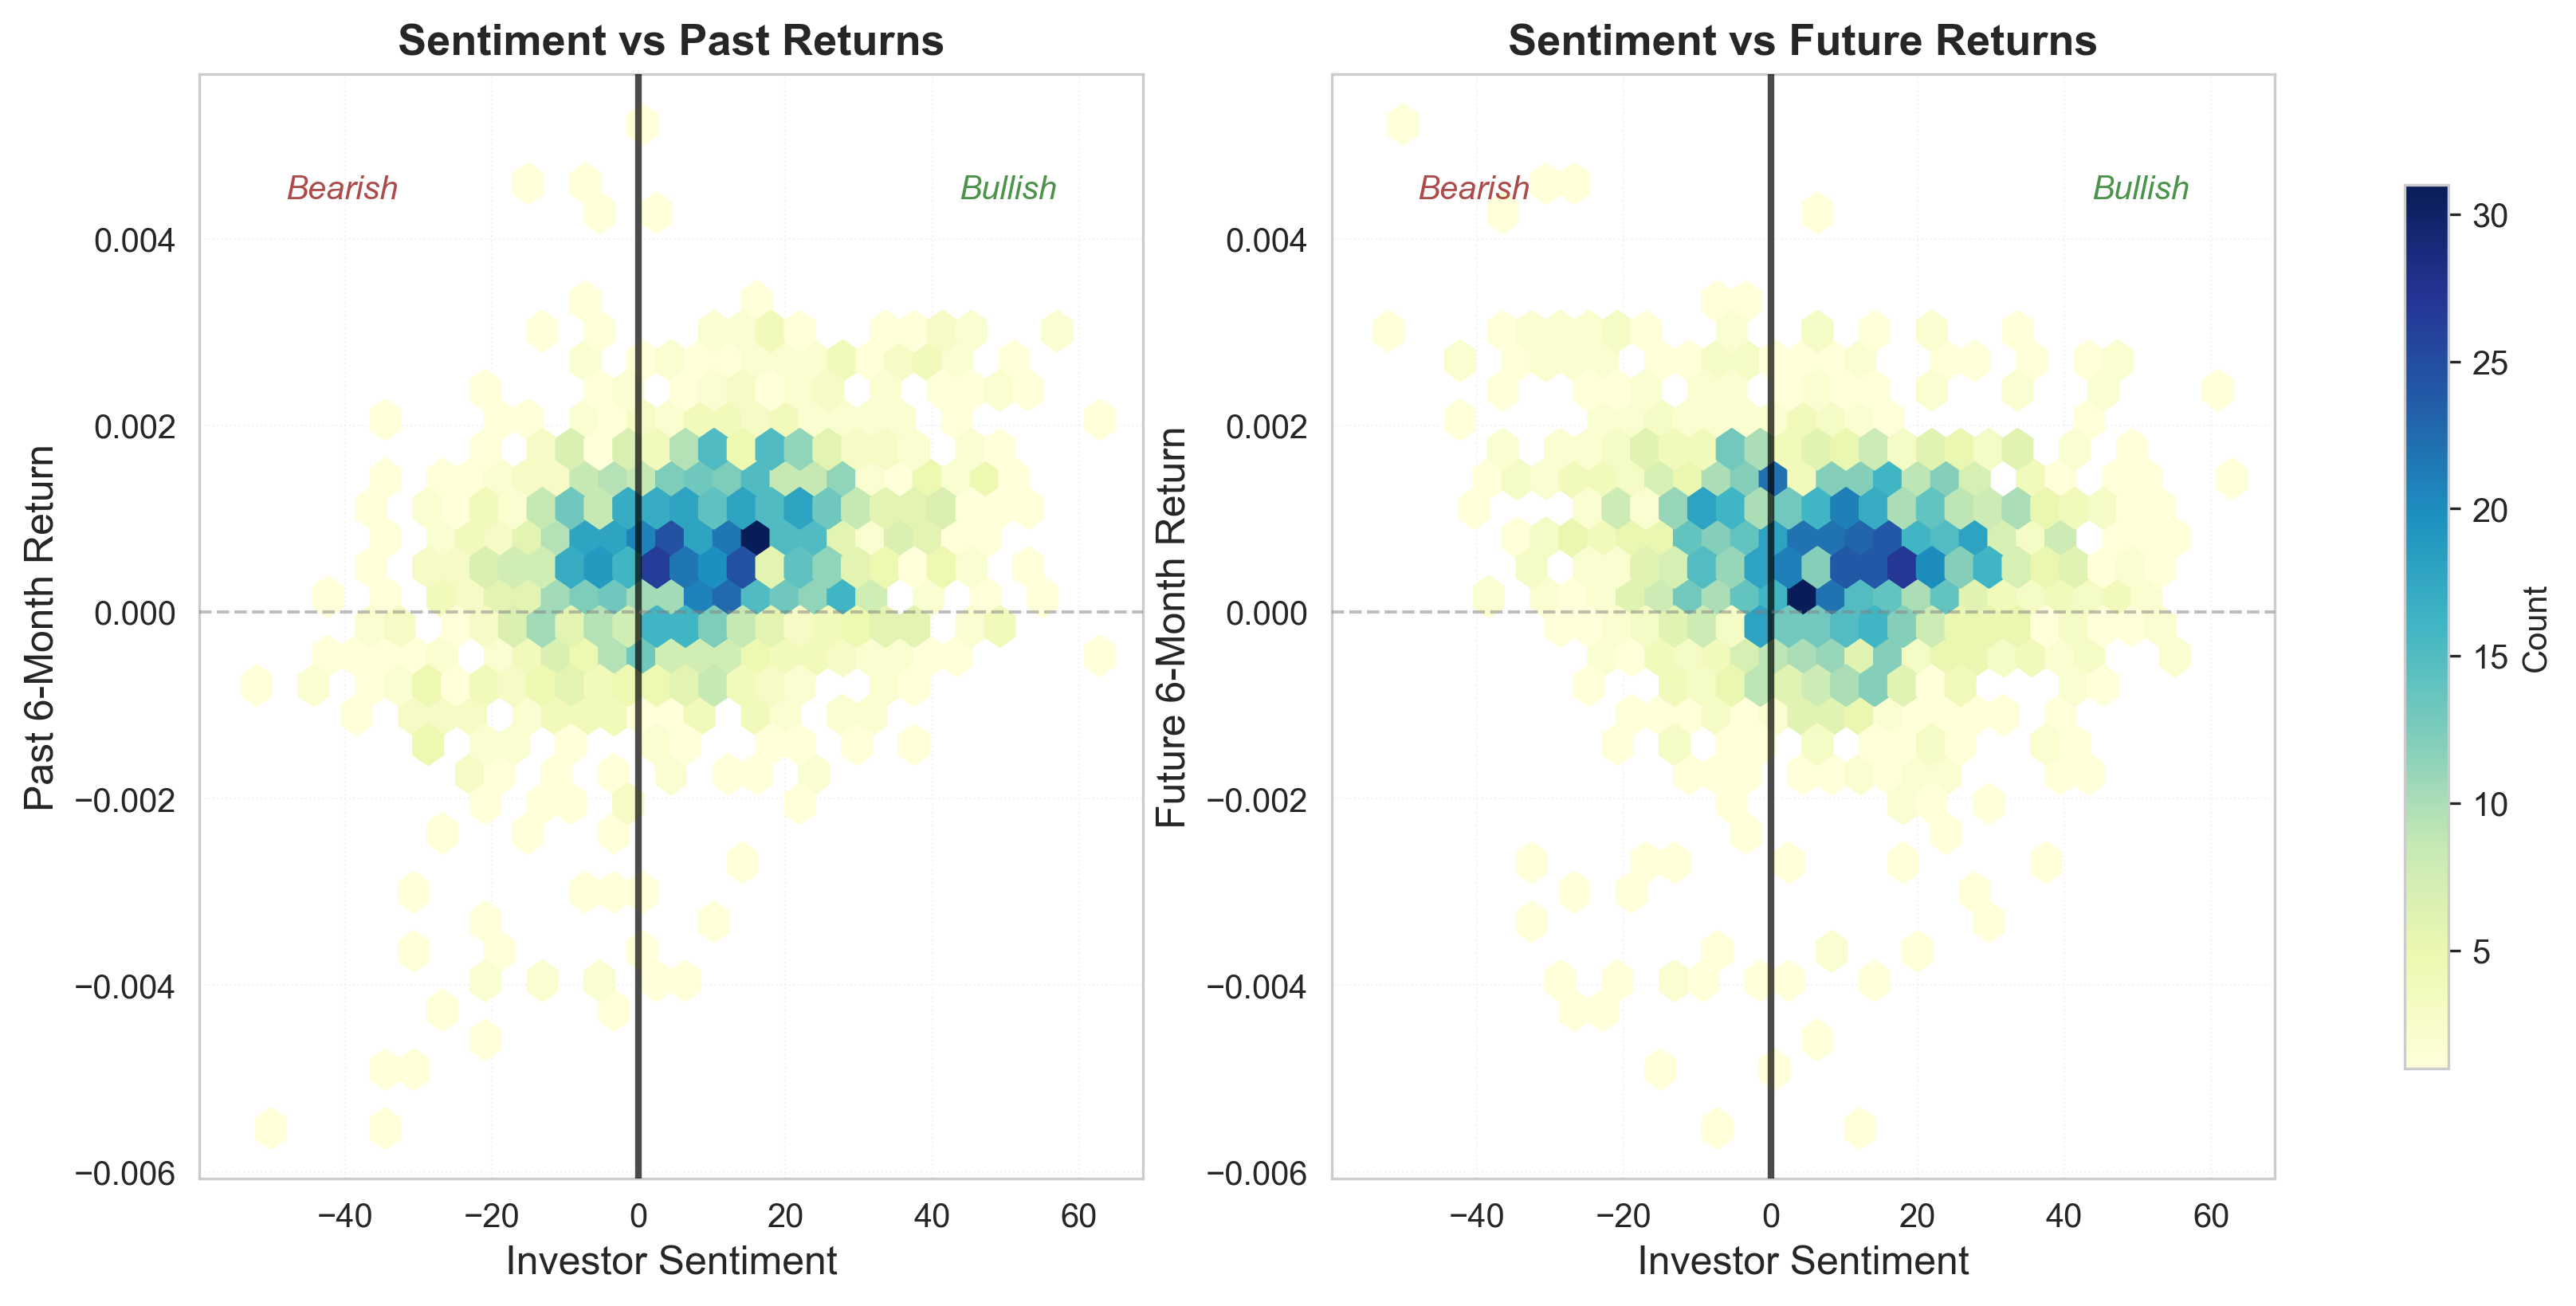
The left panel exhibits an upward tilt from bottom-left to top-right. Periods of negative past returns are associated with bearish sentiment, while positive past returns coincide with more bullish attitudes. This indicates a strong relationship between sentiment and past performance.
In contrast, the distribution linking sentiment to future returns appears more symmetric and dispersed. No clear directional pattern emerges: bullish investors do not systematically earn higher future returns, nor do bearish investors consistently experience lower ones.
Sentiment metric
Investor sentiment is summarized by a single index, S = %Bullish − %Bearish, capturing net optimism on a scale from −100 (fully bearish) to +100 (fully bullish).
Correlation with market returns
Sentiment is strongly and positively correlated with recent market performance. Investors tend to become more optimistic following periods of rising prices, consistent with trend-chasing behavior.
Looking forward, the relationship weakens and reverses sign. High levels of optimism are followed by slightly lower future returns, suggesting that excessive bullishness may precede periods of underperformance.
Overall interpretation. Sentiment appears to respond strongly to past returns but provides limited predictive power for future performance. Although both correlations are statistically significant, their modest magnitude indicates that sentiment explains only a small share of market return variation.
Initial finding. Higher optimism is associated with higher future returns, and the relationship is statistically significant and robust to outliers.
Nevertheless, correlation alone cannot establish causality: do shifts in sentiment drive markets, or do markets primarily shape investor sentiment?
The Critical Test: Granger Causality
Granger Causality asks a specific question: Does adding past values of Variable X reduce the prediction error of Variable Y, compared to predicting Y using only its own history?
The Formal Test
To test if Sentiment (S) causes Returns (R), we compare two models using an F-test:
1. Restricted Model (Null Hypothesis)
We try to predict Returns using only past Returns.
2. Unrestricted Model (Alternative Hypothesis)
We add past Sentiment to see if predictions improve.
The Test: We check if the coefficients γ (the effect of sentiment) are jointly different from zero.
If γ ≠ 0, then Sentiment "Granger-causes" Returns.
The results tell a story of complete asymmetry. By looking at the plot above, we can trace the flow of information:
The Red Line (Right Side): Sentiment fails to predict
This tests the Unrestricted Model above. The coefficient sum (∑ γ) is effectively zero. Knowing past sentiment adds no predictive power to the model. The line stays flat near zero, far below the dashed significance threshold.
The Blue Line (Left Side): Returns strongly drive Sentiment
Here we flip the equation: attempting to predict Sentiment using past Returns. The blue line skyrockets, reaching huge significance levels (p < 0.01). This confirms that yesterday's market performance is the primary driver of today's investor mood.
The Conclusion: This confirms Extrapolative Expectations. Investors assume that "what just happened" is "what will happen." When markets rise, they become bullish. When markets fall, they become bearish. They are not forecasting; they are reacting.
Session 3 Summary: The Timeline Verdict
Correlation exists but is misleading. Sentiment and returns are correlated (ρ ≈ 0.33), but this doesn't mean sentiment predicts returns.
Causality is asymmetric. Returns massively affect sentiment; sentiment barely affects returns.
Next Session Preview
We've established the direction of causality. Now let's examine the patient's mood cycles: distinct behavioral states and how sentiment affects transitions between them.
Time for the mood analysis.
Session 4: The Mood Cycles
Identifying States
Patients don't exist in a single mood, they cycle through distinct psychological states. Our patient, The Market, is no different. This session examines these mood cycles using Markov regime models and tests whether investor sentiment affects state transitions.
First, Define the Patient's Moods
Before analyzing mood cycles, we need an objective way to classify the market's own states. We let the data speak for itself.
We use a Gaussian Mixture Model (GMM) with 3 components to identify distinct market regimes. Unlike simple thresholds, GMM provides soft membership probabilities and handles the fuzzy boundaries between real market states. Features include 6-month forward returns, realized volatility, and market momentum.
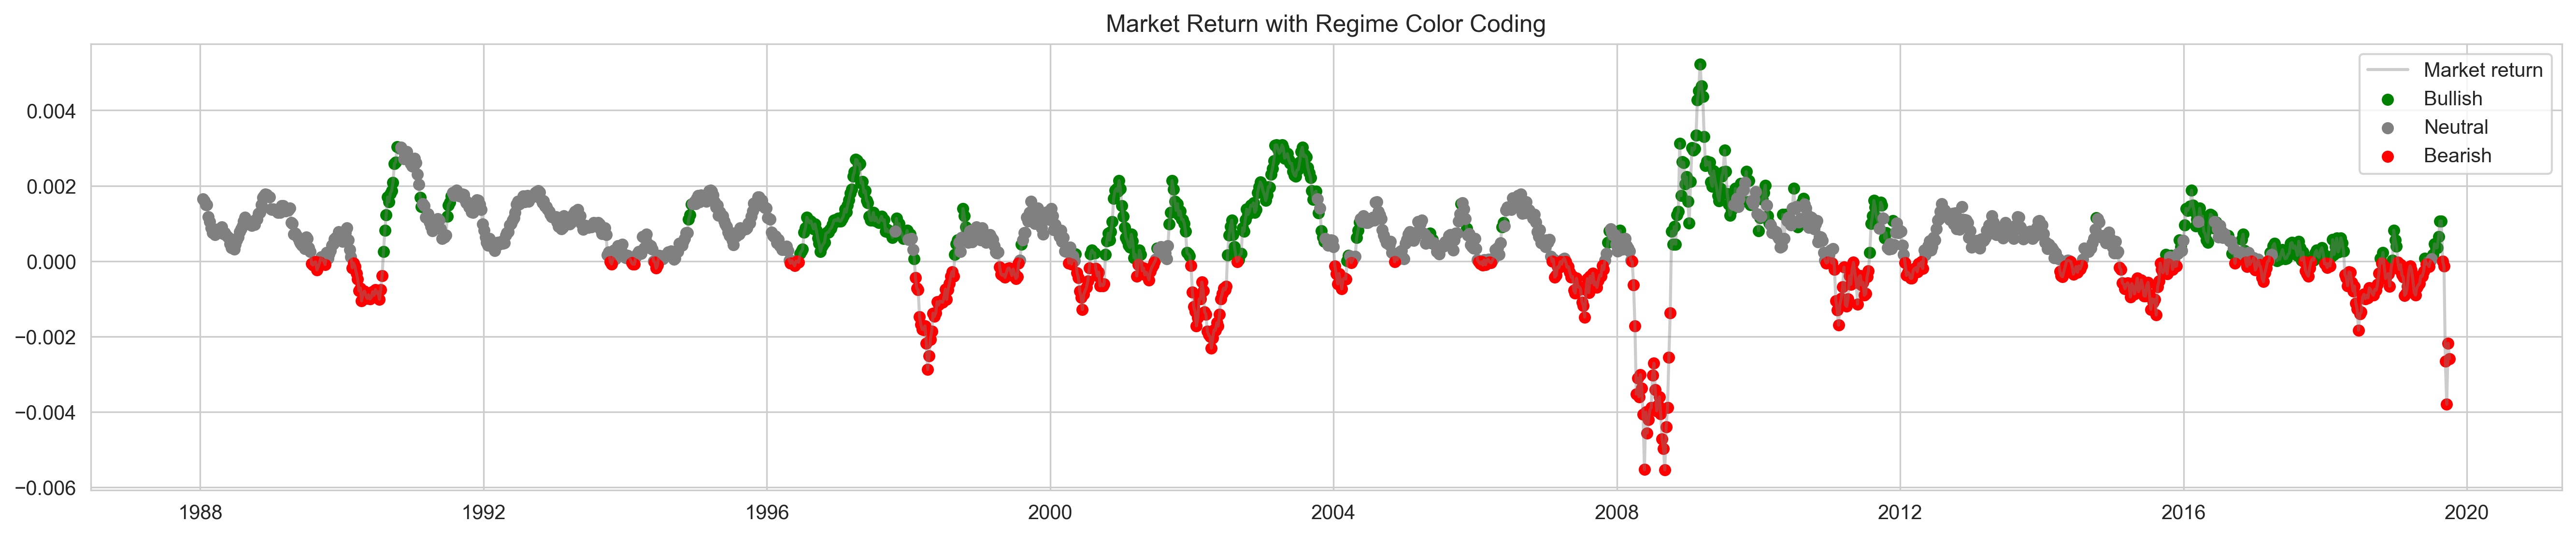
Bullish Regime
Higher returns, moderate volatility. The market is trending upward with confidence.
Neutral Regime
Mixed performance, sideways movement. The market is indecisive.
Bearish Regime
Lower/negative returns, heightened volatility. Stress and drawdowns.
Regime Transitions
A Markov model assumes the market exists in one of several discrete states, and the probability of transitioning to the next state depends only on the current state, not the entire history. The market's "mood" today tells us something about tomorrow's mood.
Unconditional Transitions
First, we examine how the market transitions between states without considering external factors like sentiment.
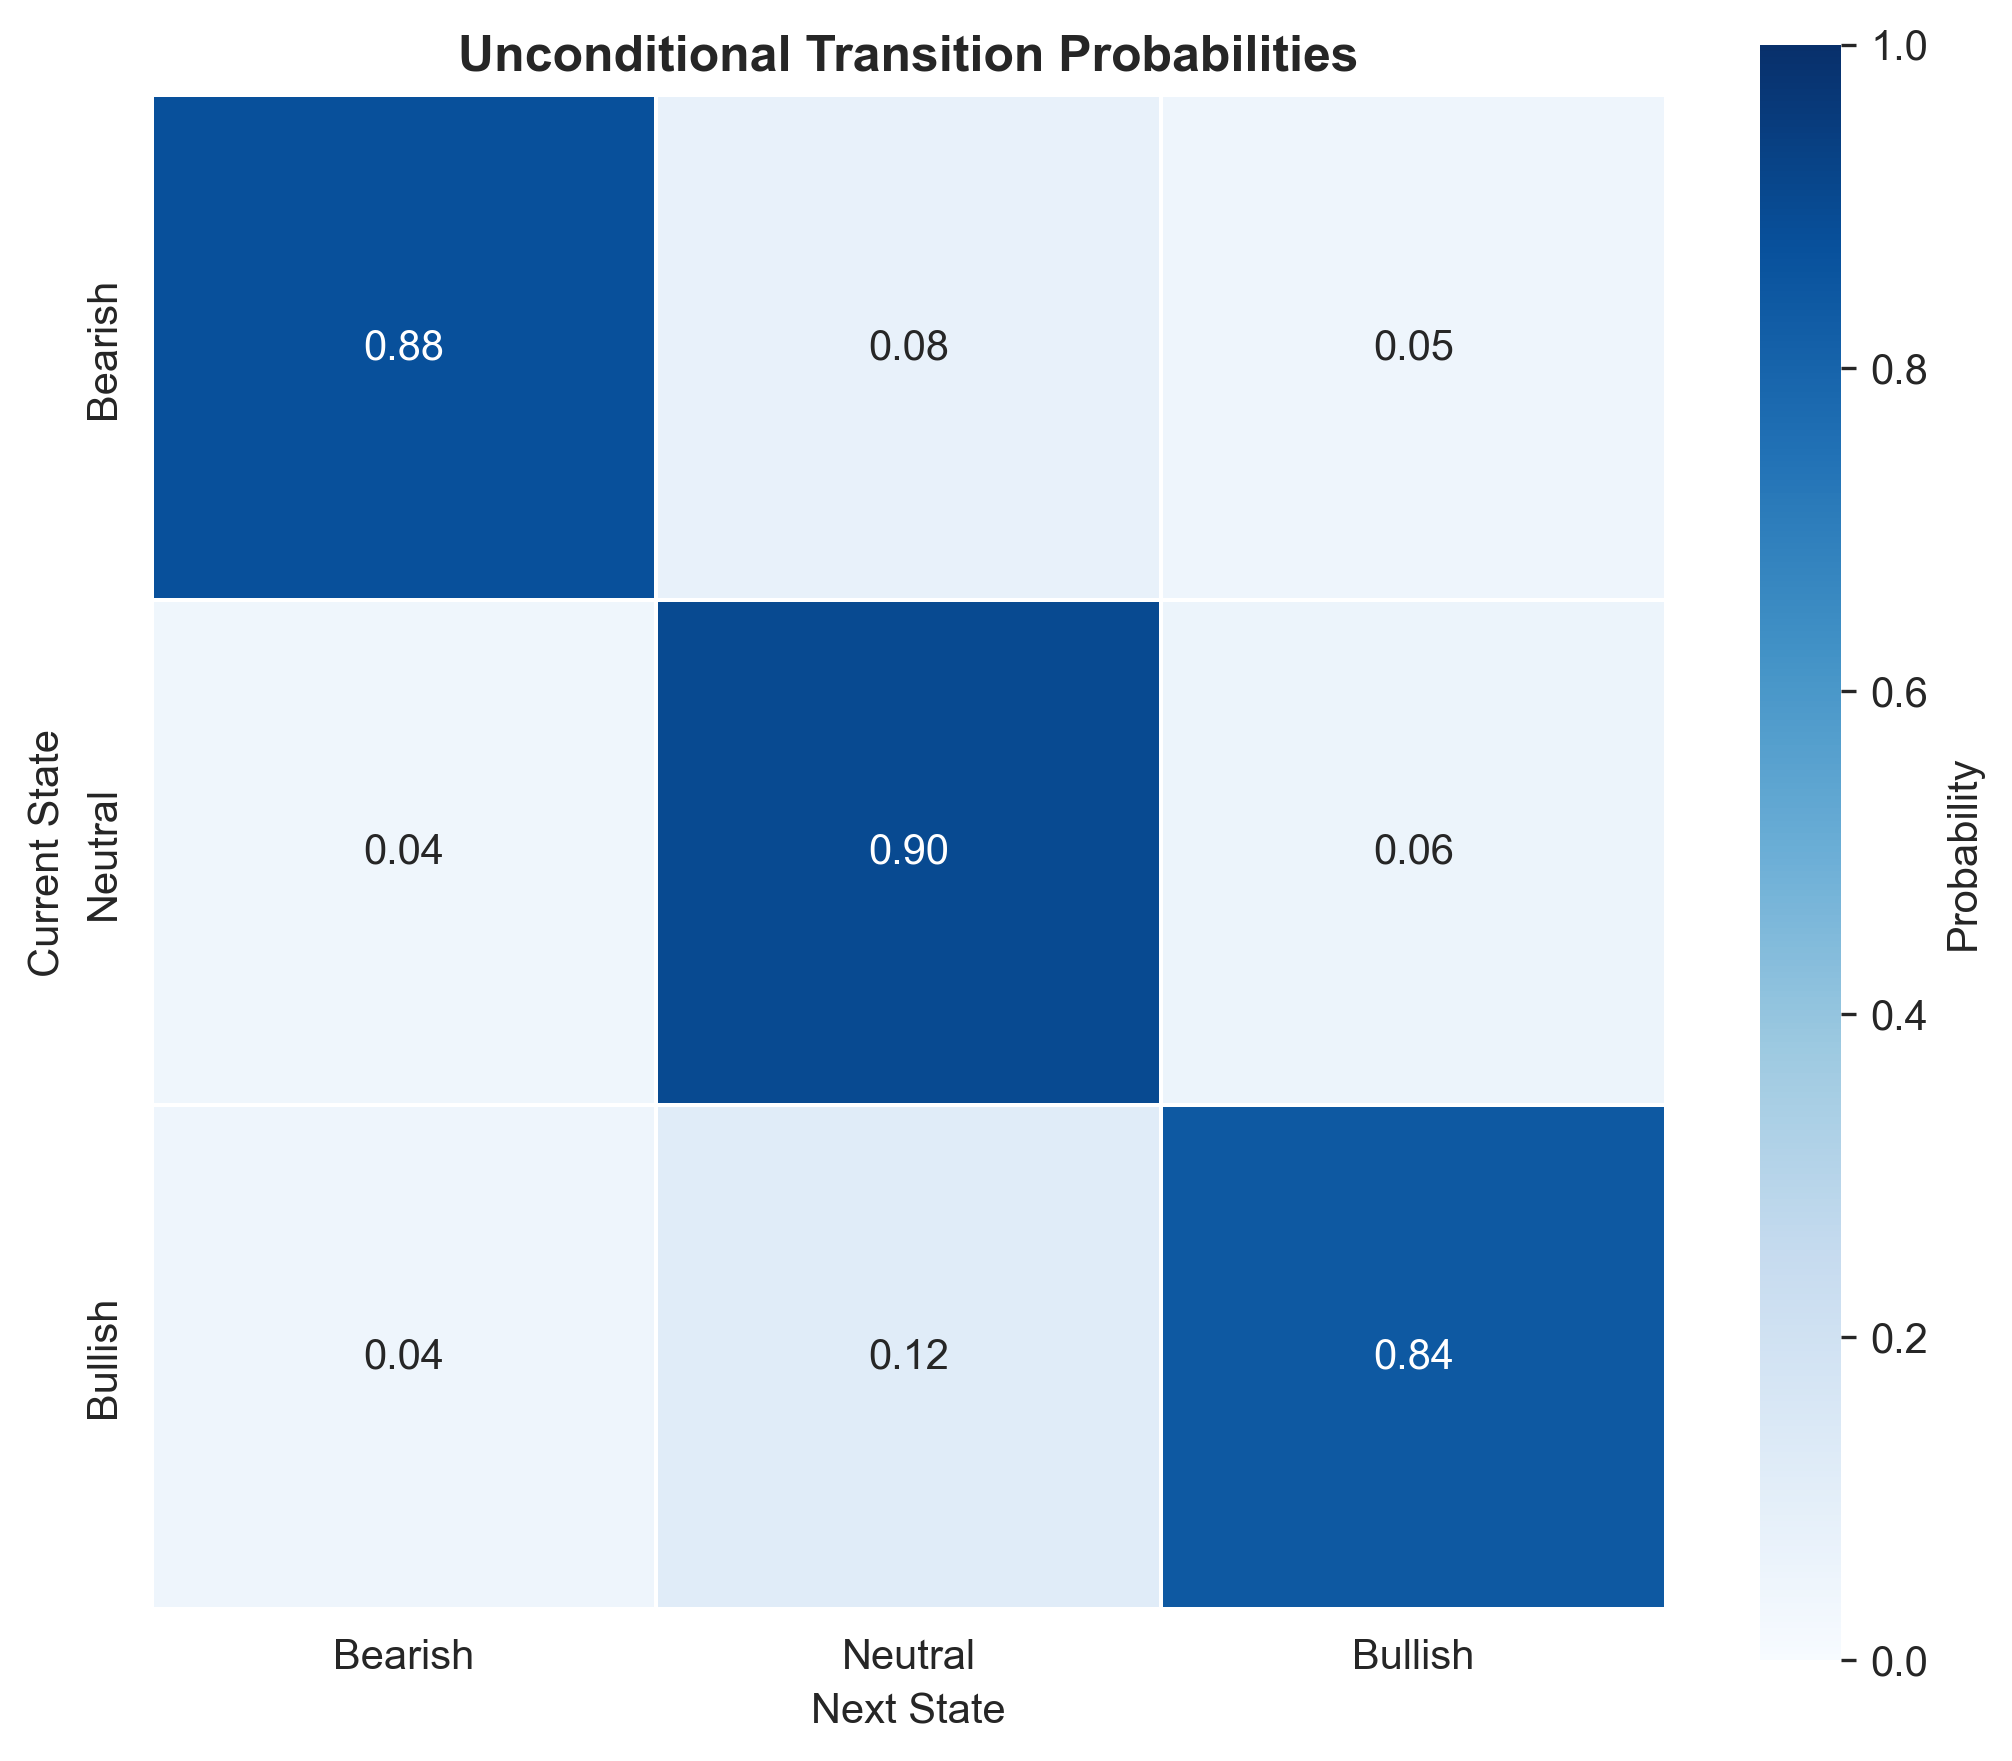
Regime Persistence Patterns
Each cell shows the probability of moving from one market state (row) to another (column):
Key Pattern: All three regimes show high persistence (84-90%), meaning once established, they tend to continue. Interestingly, neutral regimes are the most persistent at 90%, while bull markets persist at 84%. This suggests the market often stays in "wait-and-see" mode before committing to a direction.
Next: Where Does the Market Spend Its Time?
A key property of Markov chains is that, under certain conditions, they converge to a stationary distribution — a stable long-run probability distribution over states that no longer changes with additional transitions. Why does this matter for our analysis? If the empirical (observed) distribution of market regimes closely matches the theoretical stationary distribution, it suggests: 1. The market has been observed long enough to reflect its equilibrium behavior 2. The Markov model provides a reasonable description of regime dynamics 3. The regime frequencies we observe are representative of long-term expectations
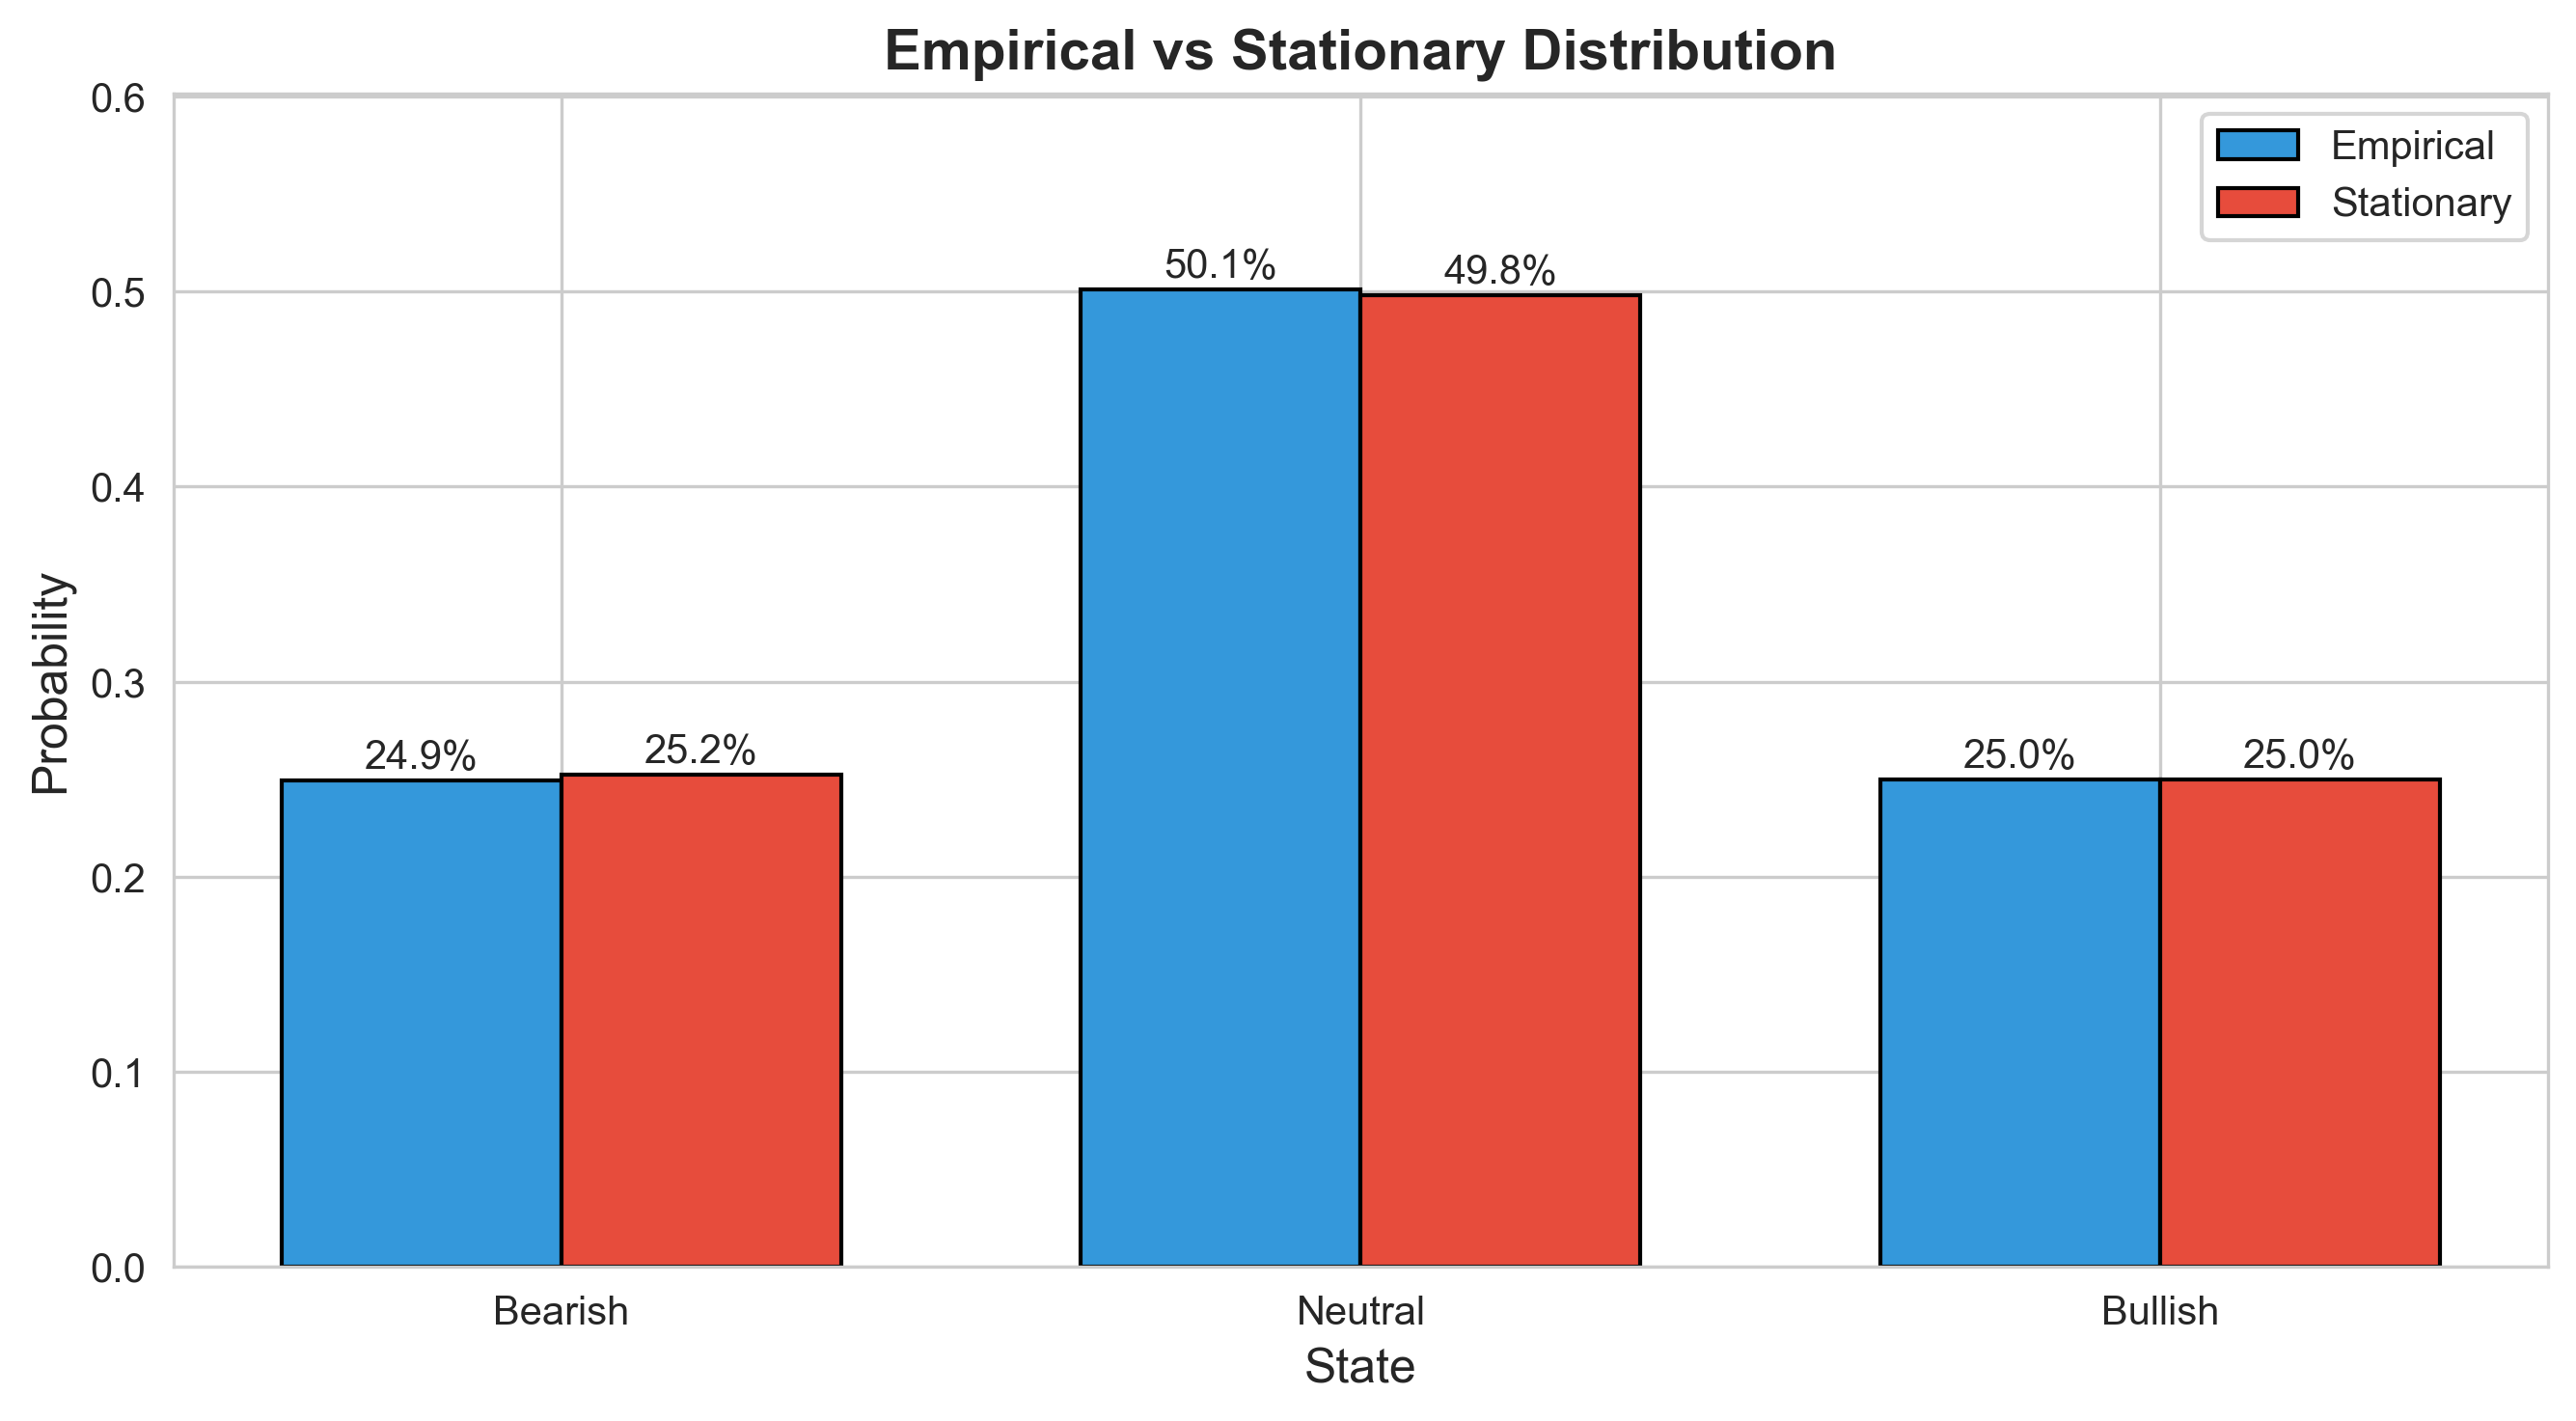
What Are We Comparing?
Stationary (theoretical): Given the transition probabilities, math tells us how often the market should be in each state if we ran the process forever.
Empirical (observed): How often the market actually was in each state. In our data: Neutral (829 weeks), Bullish (413 weeks), Bearish (412 weeks) across 1,654 total observations.
Why it matters: If these match, our Markov model is a good fit. The market's mood cycling has been consistent over time.
Finding: Close match. The market spends roughly half its time in neutral territory, with bullish and bearish periods roughly equal—consistent with the theoretical prediction.
How Long Do Moods Last?
We measure the typical duration of each market regime before transitioning:
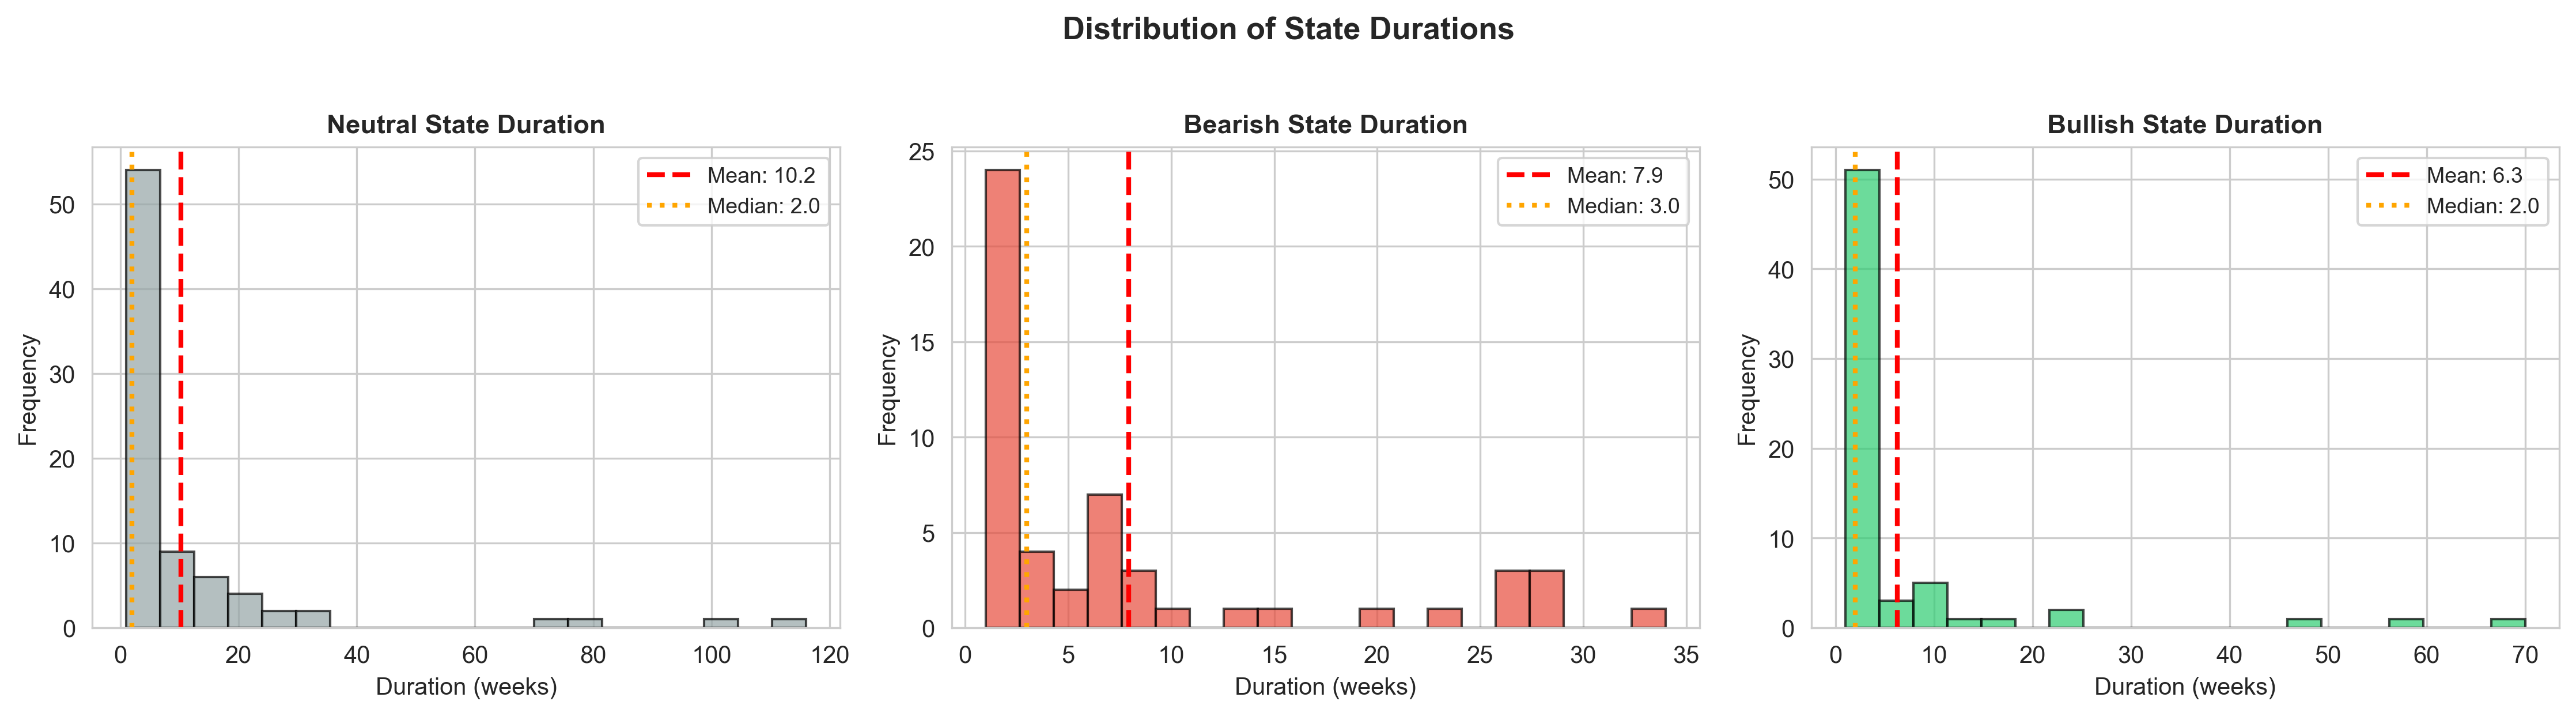
Bullish Regime
Bull markets tend to be the shortest-lasting. Upward drifts are the rarest.
Neutral Regime
Neutral states are transitional yet the most presistent. The market tends to stay sideways for long before committing to a direction.
Bearish Regime
Bear markets last longer than bullish states. Market downturns typically persist longer than bull runs.
Does Sentiment Affect Transitions?
This is where we test Hypothesis A vs. Hypothesis B at the regime level. If sentiment has power, knowing it should change our predictions about state transitions. If sentiment is just a mirror, conditioning on it should add little information.
We measure information gain: how much knowing sentiment reduces uncertainty about the next market state. Higher information gain means sentiment is more useful for prediction.
AAII Sentiment
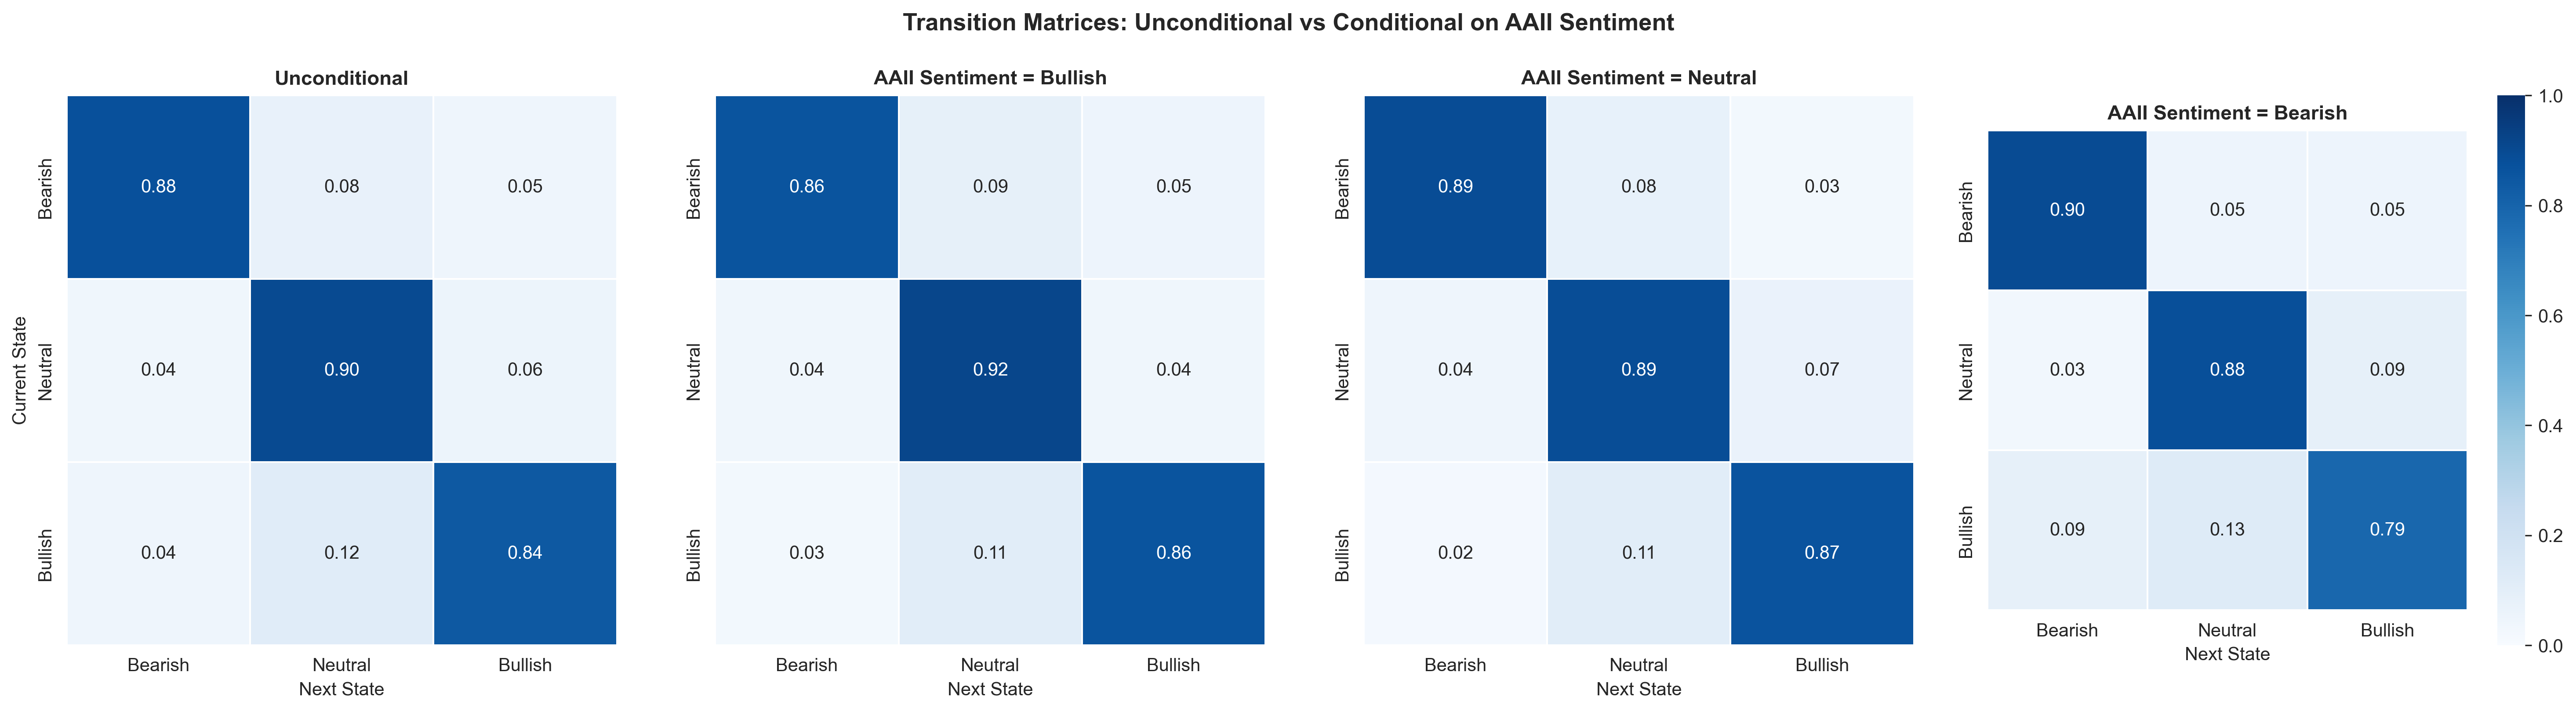
AAII Result: Information gain of only 0.002 – 0.018 bits. Knowing investor sentiment barely changes our predictions about the next market state.
Google Trends
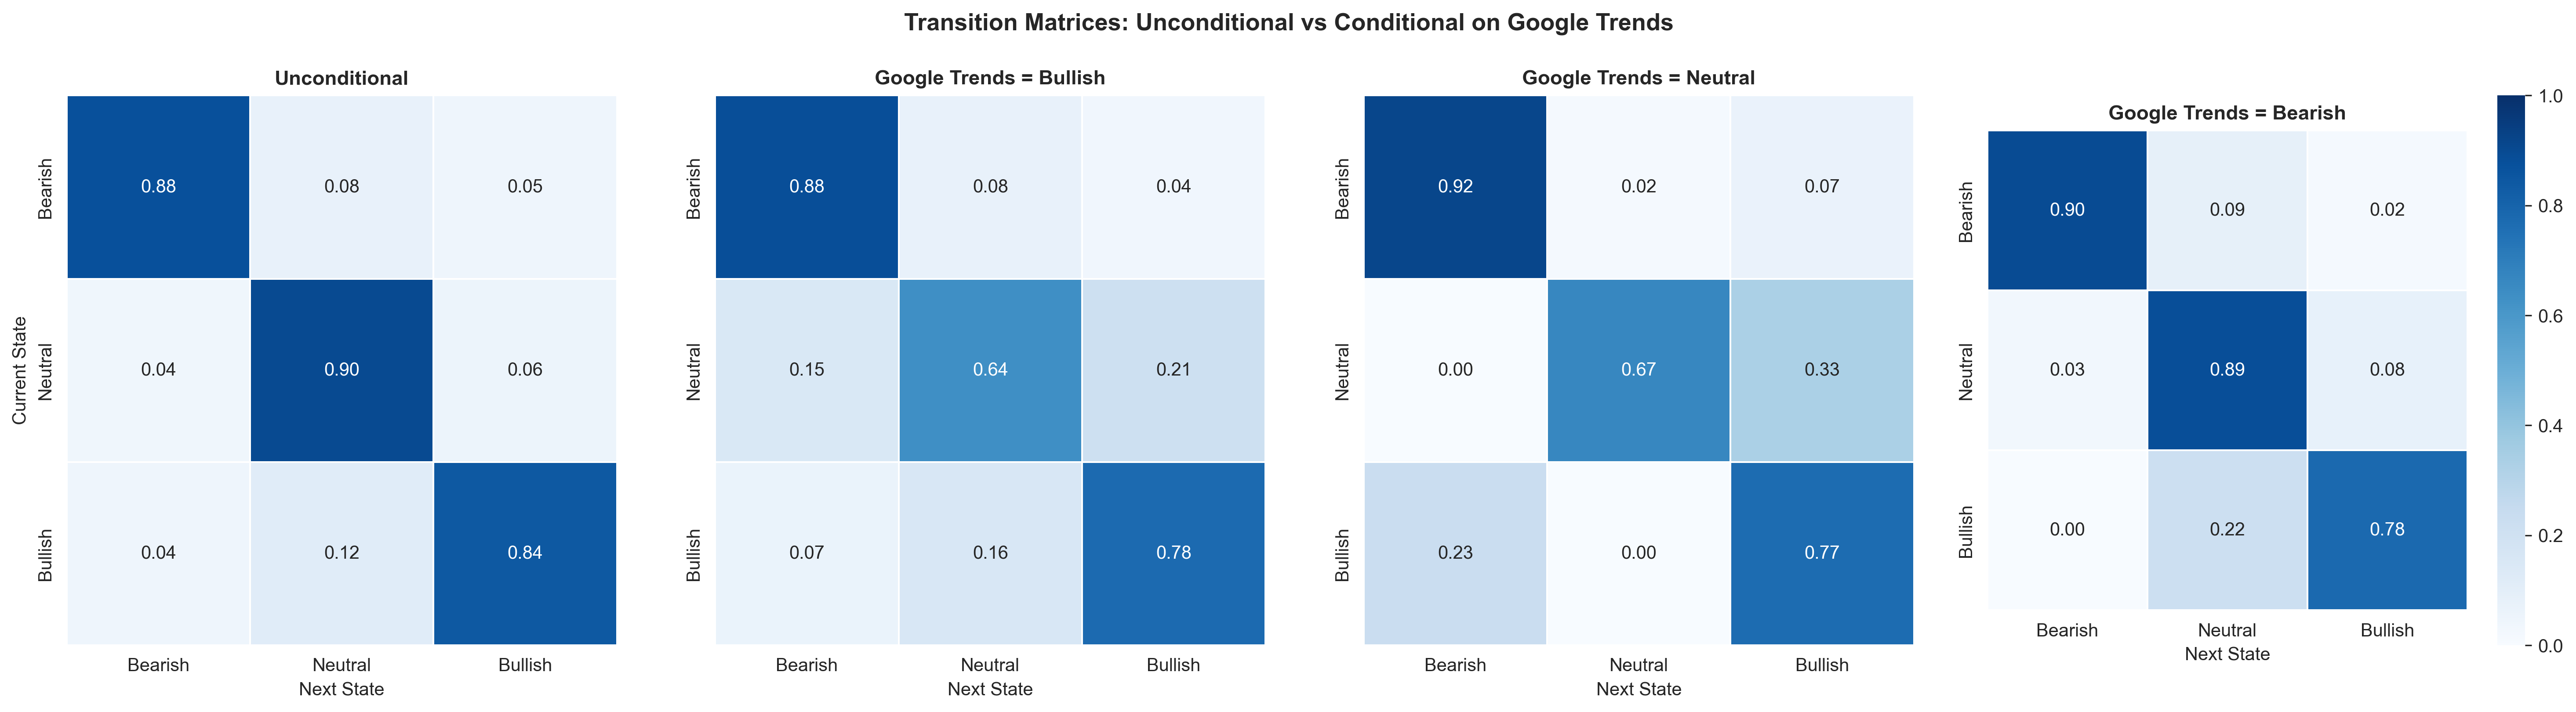
Google Result: Information gain of 0.05 – 0.07 bits—roughly 3-5x higher than AAII. Search behavior is more informative about regime transitions.
Why does Google outperform AAII? Google captures everyone (not just the ~1,000 AAII survey respondents), searches are spontaneous and unfiltered, and they happen in real-time rather than as considered weekly survey responses.
The Lead-Lag Analysis: The Smoking Gun
This is where the case breaks open. We test sentiment at various time lags, not just whether sentiment predicts, but when the relationship is strongest.
We measure information gain at different lags. Positive lags mean using sentiment from weeks ago to predict today's market state. Negative lags test if sentiment reflects past market states. If sentiment is predictive, positive lags should dominate. If reactive, negative lags should dominate.
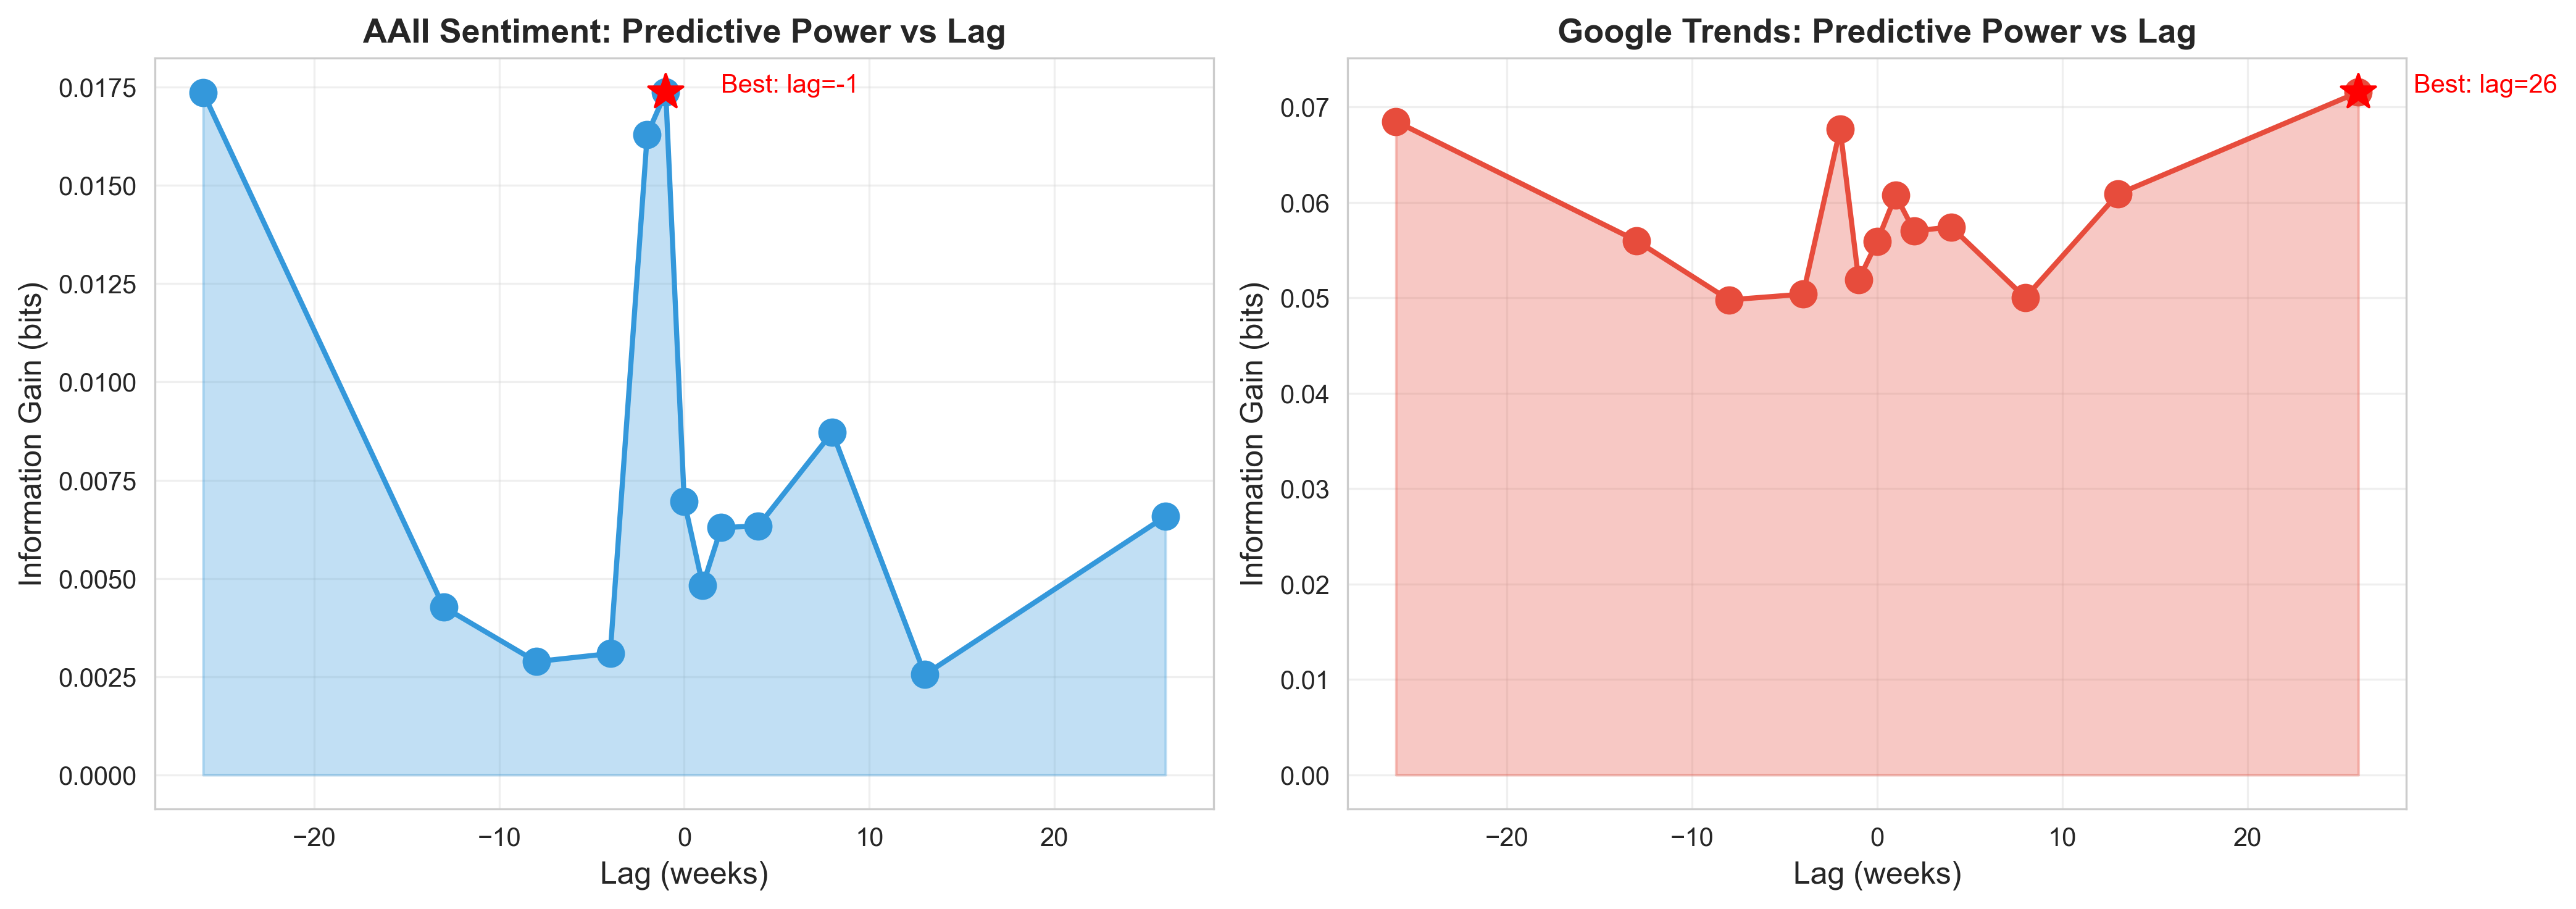
AAII: The 6-Month Mirror
AAII shows peak information at lag = -1 week as well as at lag = -26 weeks (6 months). This is striking—and not coincidental.
Remember the AAII survey question: "Where do you think the market will be in the next 6 months?" Investors answering this question appear to be anchoring on "where has the market been for the past 6 months?" and extrapolating that experience into their future outlook. They're essentially looking in the rearview mirror to predict the road ahead.
Verdict: AAII sentiment is more REACTIVE than predictive.
Google Trends: Mixed Signal
Google Trends peaks at +26 weeks with information gain of 0.05–0.07 bits, more symmetric across positive and negative lags. Search behavior captures both response to events and some anticipation of market moves.
Head-to-Head: AAII vs. Google Trends
| Aspect | AAII Sentiment | Google Trends |
|---|---|---|
| Dominant Signal | Reactive (negative lags) | Mixed (symmetric) |
| Best Lag | -1 week / -26 weeks | +26 weeks |
| Information Gain | Lower (0.002–0.018 bits) | Higher (0.05–0.07 bits) |
| Implied Behavior | Backward-looking extrapolation | Mixed reactive/predictive |
The 6-Month Mirror Effect
When AAII investors are asked "Where will the market be in 6 months?", they appear to answer "Where has the market been for the past 6 months?"
This is classic recency bias and extrapolation behavior, fundamental concepts in behavioral finance, now quantified in our data.
Session 4 Summary: Mood Cycle Findings
Regimes are persistent. Once in a mood, the market tends to stay there.
AAII adds little to regime prediction. Knowing investor sentiment barely improves our ability to forecast state transitions.
Google Trends does better. Search behavior contains more regime-relevant information than explicit surveys.
The 6-month mirror effect. AAII sentiment peaks at -26 weeks lag, investors answer "where will markets go?" by looking at where they've been.
Next Session Preview
We've treated The Market as a single entity. But does the same pattern hold across different sectors? Is tech sentiment different from energy sentiment? Time for a differential diagnosis.
Let's break it down by sector.
Session 5: Sector Breakdown
Differential Diagnosis
So far, we've treated The Market as a monolithic patient. But markets are complex systems with many sub-personalities. Does investor sentiment relate differently to Technology vs. Healthcare vs. Energy? This session performs a differential diagnosis across market sectors.
Why Sector Analysis Matters
Retail investors don't hold "the market", they hold specific stocks in specific sectors. Their sentiment may be driven by, or influence, particular industries more than others.
Hypothesis: Sector Bias
Investors may overweight certain "exciting" sectors (like Technology) when forming their market outlook, making sentiment more predictive for those sectors.
Hypothesis: Sector Heterogeneity
The sentiment-return relationship may differ structurally across sectors, with some showing lead effects and others showing only reactive patterns.
Sector Synchronization
First, let's examine how different sectors move together. The heatmap below shows correlation between sector returns, revealing which sectors tend to rise and fall in unison.
Healthcare and Consumer sectors exhibit the highest mutual synchronization, suggesting they often experience similar regime dynamics. Technology shows more moderate alignment with other sectors, indicating more sector-specific regime behavior. Financials appear relatively less synchronized with most sectors, highlighting their distinct sensitivity to credit conditions and macro-financial factors. Overall, the results suggest that while some sectors share common regime cycles, market states are not fully synchronized across the economy, supporting the use of sector-level regime analysis rather than a single aggregate market regime.
Sector Returns Analysis
How do sector returns compare across different market conditions? The scatter plot reveals the relationship between overall market sentiment and individual sector performance.
Use the dropdown to explore each sector's state evolution!
Sentiment vs. Sector Returns
Does investor sentiment predict sector returns differently across industries? This interactive visualization shows the relationship between sentiment measures and subsequent sector performance.
As you can see, the Energy sector seems to be the only one to have a positive correlation with investor sentiment: interesting! However, we should be carefull here, the correlation numbers being small, this might be not be statistically significant enough!
Next: To better understand these correlation results, let's proceded with a lead-lag correlation analysis for each sector.
Sector Lead-Lag Analysis
Just as we tested whether sentiment leads or lags the overall market, we now apply the same analysis to each sector individually. Does sentiment predict Technology differently than Energy?
As we can see, all 5 sectors appear to have highest correlation for negative lags, suggesting that investors respond to past performance, which matches the market analysis results!
Sector Comparison
How do sectors rank in terms of sentiment predictability? The bar chart below compares information gain across all sectors.
Sector Comparison results:The left panel shows that sentiment–return correlations are predominantly negative across sectors, with the strongest contrarian relationship observed in Technology and Consumer sectors, indicating that elevated sentiment is typically followed by lower subsequent returns, which again shows the lack of predictive power of investor sentiment! Energy stands out as the only sector with a mildly positive correlation, consistent with its stronger exposure to persistent commodity price cycles rather than valuation-driven mean reversion. The right panel shows that, despite these small linear correlations, sentiment still provides non-negligible predictive information for regime transitions, particularly in Technology, Financials, and Consumer sectors. This highlights that sentiment effects are largely nonlinear and regime-dependent, explaining why information gain reveals structure that simple correlations fail to capture: in particular, the Technology sector exhibits the strongest (negative) correlation with sentiment, suggesting that investor optimism does not translate into accurate directional forecasts for future returns. Instead, sentiment appears to function primarily as a contrarian indicator: periods of heightened enthusiasm toward technology are more often followed by weaker performance, implying that when investors collectively expect strong outcomes in this sector, the opposite outcome is statistically more likely!
Are Investors Sector-Biased?
When forming their market outlook, do retail investors overweight certain sectors? The data suggests yes: AAII sentiment correlates more strongly with "exciting" sectors like Technology than with "boring" sectors like Utilities.
This has important implications: retail investor sentiment may be a poor proxy for overall market conditions and a better proxy for a specific subset of high-visibility stocks they're actually paying attention to.
The Sector Story: A Nuanced Picture
The sector breakdown reveals that "the market" is really many markets. The sentiment-return relationship varies:
Strongest in high-attention sectors like Tech, where retail investors concentrate their attention and trading.
Weakest in institutional/commodity-driven sectors (Energy, Utilities) where fundamentals dominate and retail sentiment has little impact.
Mixed in economically sensitive sectors (Financials) which respond to both sentiment and macroeconomic conditions.
This heterogeneity is important: investor sentiment, even when it contains information, is not uniformly relevant across a diversified portfolio.
Session 5 Summary: Differential Diagnosis
Sectors differ. The sentiment-market relationship is not uniform: it varies by industry.
Attention bias exists. Retail investors likely overweight high-visibility sectors when forming overall market views.
Predictive power varies. Sentiment may have more predictive value for attention-grabbing sectors, less for fundamentals-driven ones.
Implications for trading. Any sentiment-based strategy needs to be sector-aware, blanket approaches miss important heterogeneity.
Final Session
We've completed our examination. Time to synthesize everything we've learned and deliver our final diagnosis.
What did we learn about The Market?
The Diagnosis
What We Learned About The Market
After five intensive sessions examining our patient through the lens of investor sentiment, market behavior, and statistical analysis, we are ready to deliver our findings.
The Official Diagnosis
Primary Finding Retail Investor Sentiment Is Primarily Reactive
Despite asking about the future ("Where will the market be in 6 months?"), AAII survey respondents largely report their experience of the past. The peak at lag = −26 weeks matches the survey’s 6-month horizon exactly.
Evidence The 6-Month Mirror Effect
When investors are asked to predict the future, they anchor on where the market has been. This reflects recency bias and extrapolation behavior, now quantified.
Comparison Google Trends Outperforms Surveys
Aggregate search behavior contains more market-relevant information than explicit expectations surveys. The crowd’s unconscious behavior reveals more than conscious predictions.
Key Findings Summary
Retail Investors Are Backward-Looking
The AAII survey, despite asking about the next 6 months, primarily reflects what the market did over the past 6 months. Investors extrapolate recent experience into future outlook.
Correlation Is Real But Misleading
Sentiment and future returns are positively correlated (ρ ≈ 0.33), but this does not imply predictive power. The correlation exists because both reflect past market conditions.
Google Trends > AAII Surveys
Aggregate search behavior contains more market-relevant information than explicit surveys. Spontaneous behavior reveals more than considered opinions.
Market Efficiency Confirmed
By the time retail investors update their views, the information is already priced in. Professional investors and market mechanisms incorporate information faster than sentiment surveys can capture.
Sectors Are Not Equal
The sentiment-market relationship varies by industry. High-attention sectors may show stronger ties to retail sentiment; commodity-driven sectors less so.
The Patient's Prognosis
Diagnosis: The Market Doesn't Need Therapy—Its Investors Do.
After extensive observation, we've reached an interesting conclusion: the patient is remarkably self-aware. Investor sentiment, it turns out, is not a leading indicator but a lagging echo—reactive, emotional, and perpetually chasing yesterday's moves. Google Trends, by contrast, reveals a more balanced dance with the market, suggesting that collective curiosity moves in step with prices rather than behind them. The real behavioral disorder? It's not in the market's price action—it's in the investors who mistake their hindsight for foresight. Our prescription: stop trying to read the market's mind and start examining your own!
Final Thoughts
"The four most dangerous words in investing are: this time it's different."
— Sir John Templeton
Our analysis suggests a corollary: "The four most common words in investor sentiment are: it was like this."
The market prices information before the crowd catches up. By the time sentiment surveys reflect a trend, the smart money has already moved on.
The Market doesn't need to listen to investors. It's already heard them, and moved on.
Session Complete
— empanADA Behavioral Finance Clinic